What is the Reporting and Insights Dashboard?

Need real-time data at a glance to make decision-making convenient? The Reporting and Insights Dashboard displays all the key metrics, graphs and performance indicators of your line.
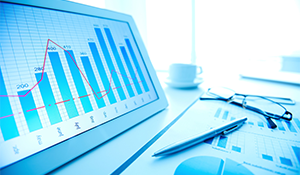
Visually Represented Data at a Glance
Track your line's progress and print reports to analyze the driving factors for its overall productivity, availability, and quality.
Since we are visually inclined, reading charts, graphs and tables are quicker to assess and gain an overall view of manufacturing and production insight, from process-related metrics to their impact represented in monetary terms. Creating and running Excel sheets is legacy-based and can be cumbersome to manage and configure.
Hence, we're simplifying the entire ordeal to view graphically depicted live data based on the line's hourly performance.
Simplified and Accurate Real-Time Data
Decision-making is largely dependent on visual data from a collection of different processes and manufacturing activities. However, it can put you in quite a pickle to revisit tens of pages to gather all these pieces of information and create a knowledge-base from it.
We've made it a lot easier for you to track historical and ongoing processes so that you can course correct them instantly! The reporting and insights dashboard is a one-stop-shop for all of your line's KPIs and failure reason codes.